Number plane
Reading and plotting points on the number plane in all four quadrants, and making tables of values and straight-line graphs from rules, patterns and real data.
Downloads
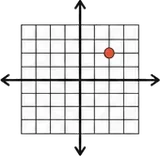
The number plane is a grid with two number lines, called axes, that cross at right angles. Any point on it can be described by a pair of numbers called coordinates, such as (3, 5). Maps, game boards, spreadsheets and computer screens all use the same idea. In this topic you'll read and plot points, use negative numbers to reach all four quadrants, and turn rules and patterns into tables of values and straight-line graphs. You'll also read graphs of real situations, like a tank filling up or a car using fuel on a road trip.
What you'll learn
- 10.01 The number plane: the x-axis, the y-axis and the origin, reading and plotting points such as (4, 7), and moving and measuring along the grid.
- 10.02 Directed numbers on the number plane: negative coordinates, the four quadrants, and drawing shapes that cross the axes.
- 10.03 Graphs of linear relationships: tables of values from rules and growing patterns, plotting straight-line graphs, finding rules, and describing what graphs of real data show.
Which level should I pick?
Every worksheet comes in three levels. Each one covers the same skills.
- Level 1 · Warm-up: smaller grids and more help along the way. A good place to start.
- Level 2 · Core: the main worksheet for the lesson.
- Level 3 · Challenge: grids with different scales, missing corners, coordinate puzzles and harder graphs, for when the Core level feels easy.
Not sure? Start with Level 2. If the first few questions feel tricky, drop to Level 1. If you finish quickly and get them right, try Level 3. Download the worksheet, print it, and write your answers in the boxes. When a question asks you to plot points, draw them on the grid printed on the worksheet, using a sharp pencil and a ruler.
Practice tests
When you've finished the lessons, try the three practice tests. Each one is like the real topic test: 45 minutes, 40 marks, a section without a calculator and a section with one. Write your working under each question, then copy your final answers onto the answer sheet on the last page, just like you will in the real test.
Curriculum outcomes
What this topic covers in the Australian Curriculum (version 9).
describe relationships between variables represented in graphs of functions from authentic data
generate tables of values from visually growing patterns or the rule of a function; describe and plot these relationships on the Cartesian plane
Outcomes lesson by lesson
- 10.01 The number planeAC9M7A05
- 10.02 Directed numbers on the number planeAC9M7A05
- 10.03 Graphs of linear relationshipsAC9M7A04AC9M7A05